
VarDyn: Dynamical joint-reconstructions of Sea Surface Height and Temperature from multi-sensor satellite observations
- Project by: Science Hub Team
- September 13, 2024
Objectives
The use of satellite data has revolutionized the study of upper ocean dynamics, offering global, continuous, and real-time information about various physical processes at the ocean’s surface. These data provide key insights into ocean circulation, temperature distribution, wave patterns, and other dynamic factors. For instance, Sea Surface Height (SSH), observed by altimetry, is a key variable for monitoring ocean circulation. Similarly, Sea Surface Temperature (SST) serves as a crucial indicator of heat exchange between the ocean and atmosphere.
Typically, scientific and operational applications require gap-free, gridded satellite data (L4 products). However, operational algorithms often depend on basic interpolation techniques applied to L3 satellite data, which tend to filter out fine-scale processes. In this project, an hybrid methodology, called VarDyn, which combines minimal physically-based constraints with a variational scheme is designed to enhance the mapping capabilities of upper ocean dynamics. By synthesizing multi-modal satellite observations, VarDyn aims at improving the accuracy of SSH and SST maps in comparison to operational products, both in terms of RMSE and effective spatial resolution.
Data
Near-real time along-track SSH products are considered (DOI https://doi.org/10.48670/moi-00147). The 1Hz product of all available missions (Sentinel-6A, Jason-3, Sentinel-3A, Sentinel-3B, Saral/AltiKa, Cryosat-2, HY-2B) are used. DUACS multimission altimeter data processing system ensures all the mission measurements to be homogenized with respect to Sentinel-6A ones (reference missions).
For SST observations, estimates from the Advanced Microwave Scanning Radiometer (AMSR-2) and the Global Precipitation Measurement Microwave Imager (GMI) are considered (version 8.2). To benefit from their time sampling coverage, both ascending and descending passes are selected. Diurnal cycle corrections are not applied. The data are distributed by the Remote Sensing Systems (REMSS, https://data.remss.com).
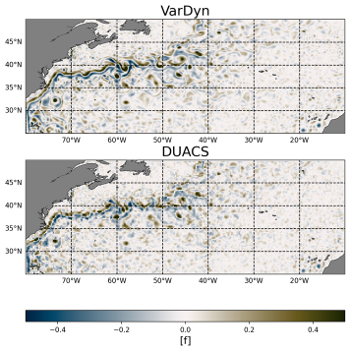
Figure 2: Relative Vorticity derived from SSH for the VarDyn product (top) and for the operational DUACS product (bottom)
Method
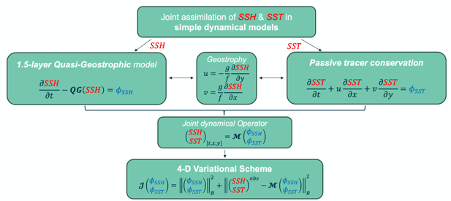
The VarDyn (for Variational Dynamical interpolation) method is illustrated on Figure 1. SSH and SST observations are jointly assimilated in simple dynamical models: (i) SSH dynamics is simulated by a 1.5-layer Quasi-Geostrophic (QG) model; (ii) SST dynamics is simulated by the passive tracer conservation law. The two models are coupled by the geostrophic assumption, assuming that SST is advected by the SSH-derived geostrophic currents. The SSH and SST observations are assimilated within a 4D Variational scheme, optimizing the forcing fluxes of the reduced models to fit the simulated trajectory to the observations.
Results
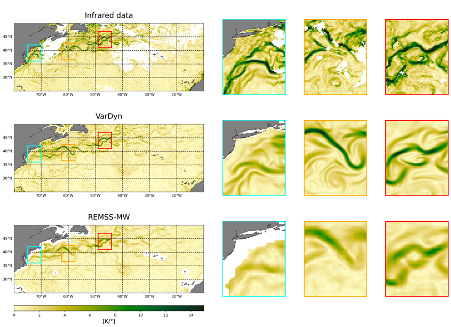
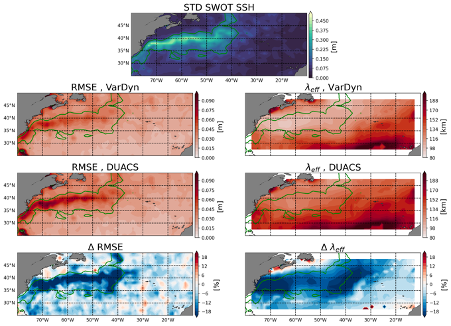
As a proof of concept, the VarDyn method has been tested in a study domain spanning the Gulf Stream and its extension. The reconstructed SSH and SST maps have been compared with high resolution independent satellite data: (i) from the recently launched SWOT satellite for SSH and (ii) from infrared sensors (e.g., onboard Sentinel-3) for SST. Systematic comparison with state-of-the-art operational products (DUACS L4 for SSH, REMSS-MW L4 for SST) have been performed.
Qualitatively, the VarDyn products reveal smaller scale structures than in the operational products, with better contrasts and improved continuity of frontal structures and eddies (Figure 2 and Figure 3).
Quantitatively performances show a clear gain in RMSE, reaching 30% (10%) in high (low) energetic areas for SSH (Figure 4). The same conclusion applies for effective spatial resolutions: most of the gain occurs in high energetic areas while matching operational resolutions in low energetic areas.
Perspectives for Future Research
For future investigations, an original asset of the VarDyn method is an estimation of the SST forcing terms.
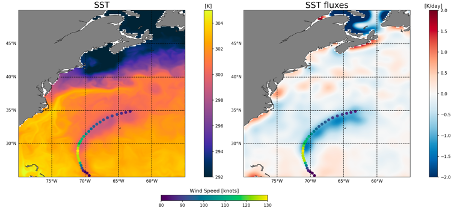
These effective fluxes contain many hidden contributions: atmospheric fluxes, vertical and ageostrophic advection, mixed layer depth variations. Figure 5 illustrates the resulting signature of a hurricane marine cold wake and the associated SST fluxes. More dedicated investigations are needed, but VarDyn opens numerous perspectives, such as the study of amplification mechanisms and/or restratification rates for extreme events, like cyclones and marine heatwaves.
Publications
- Le Guillou, F., Gaultier, L., Ballarotta, M., Metref, S., Ubelmann, C., Cosme, E., and Rio, M.-H.: Regional mapping of energetic short mesoscale ocean dynamics from altimetry: performances from real observations., EGUsphere [preprint], https://doi.org/10.5194/egusphere-2023-509, 2023.
- Florian Le Guillou, Bertrand Chapron, Marie-Hélène Rio. VarDyn: Dynamical joint-reconstructions of Sea Surface Height and Temperature from multi-sensor satellite observations. ESS Open Archive . September 12, 2024., DOI: 10.22541/essoar.172616118.81277809/v1
Code and data
- VarDyn SSH and SST products can be obtained through the ESA Open Science Catalogue:
- For a constellation of seven altimeters: https://opensciencedata.esa.int/stac-browser/#/products/vardyn-ssh-allsat-L4/collection.json
- For a constellation of two altimeters: https://opensciencedata.esa.int/stac-browser/#/products/vardyn-ssh-twosat-L4/collection.json
- The numerical codes of the VarDyn algorithm along with the diagnostics described in the paper can be found here: https://github.com/leguillf/MASSH
This research was carried out by Florian Le Guillou.