
SWOT’s new observational capacity at the ocean surface fine scales enables the reconstruction of precise vertical dynamics
- Project by: Science Hub Team
- October 1, 2025
Dr Elisa Carli, Internal Research Fellow @Esrin Science Hub
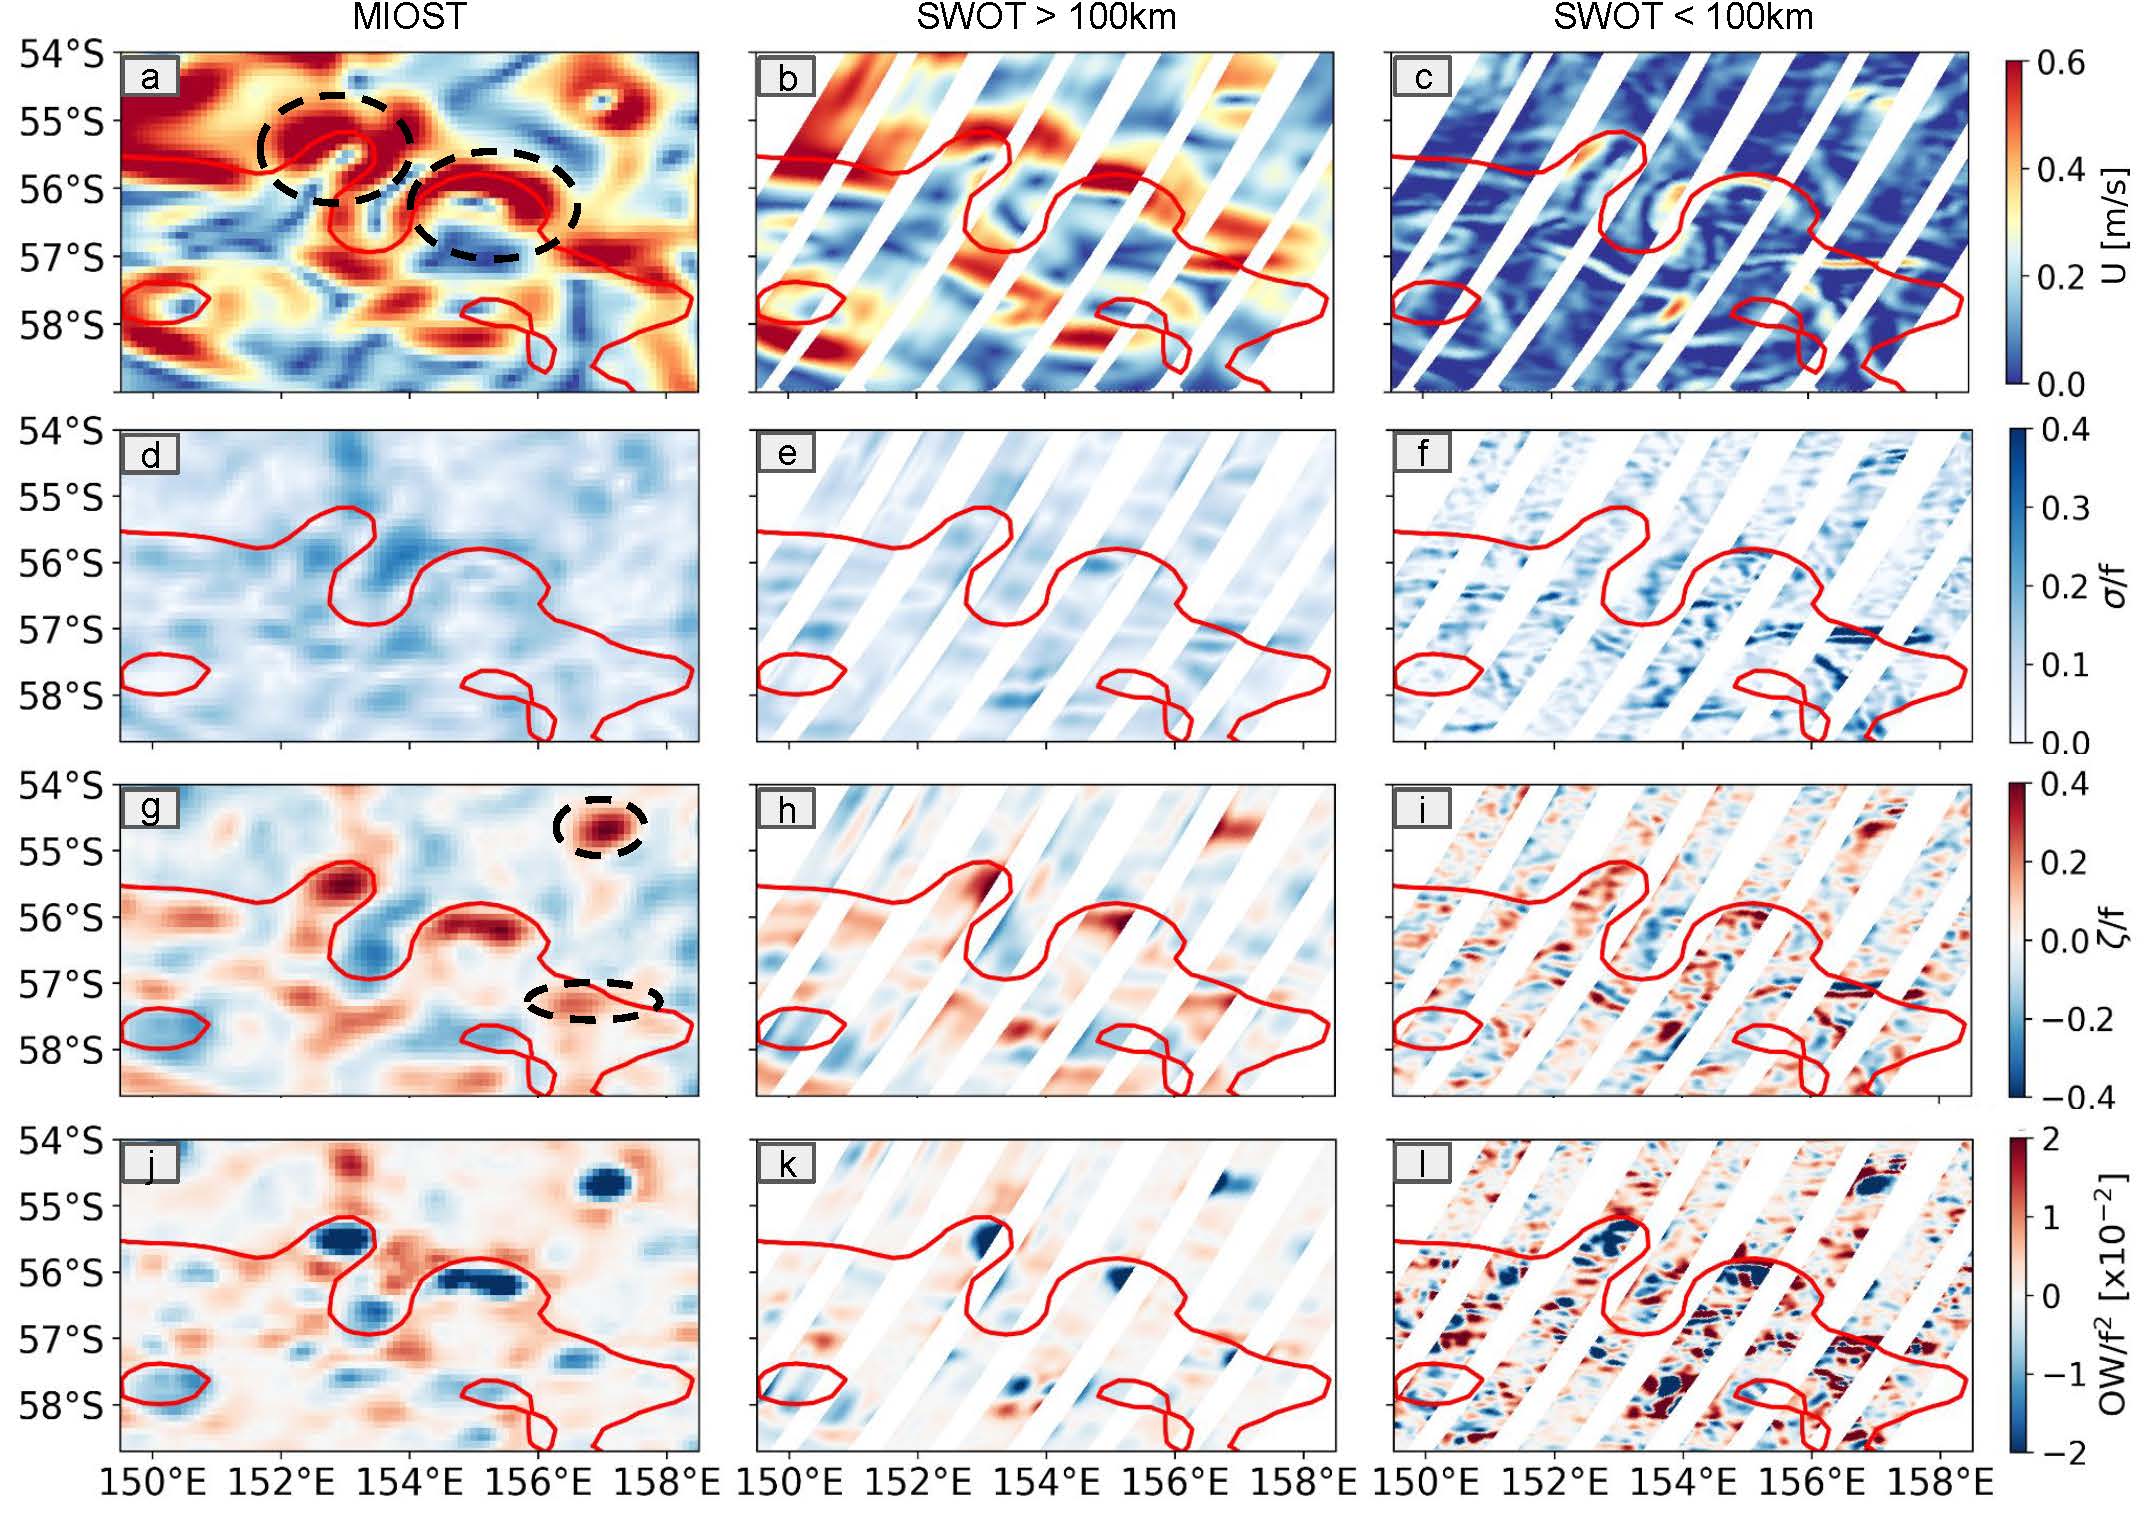
The Surface Water and Ocean Topography (SWOT) is an innovative radar altimeter launched at the end of 2022 with a joint CNES (Centre National d’Études Spatiales)/NASA mission. Thanks to its onboard technology, it has the unprecedented ability to map ocean features at the fine scales (size of the ocean structures between 20 and 100km). These features are critical for understanding vertical velocities, which pump heat, carbon and nutrients from the surface to depth, important for biomass development.
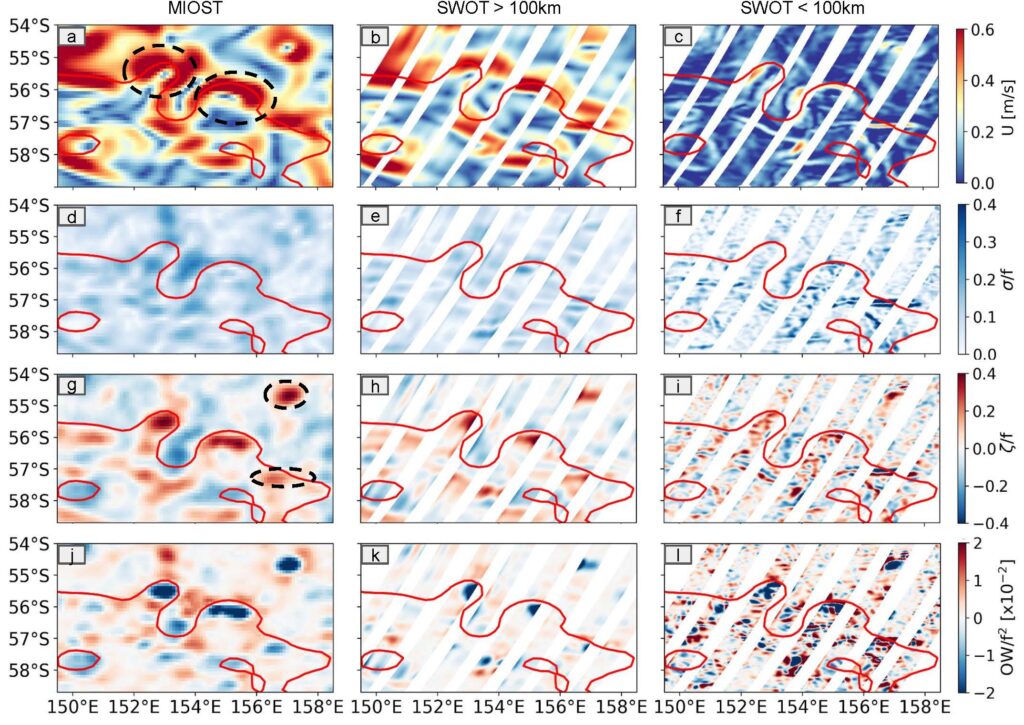
In this work we use key dynamical metrics to compare the contributions of the different structures to various ocean processes. While large scales dominate the overall flow, smaller scales significantly enhance the stretching and straining of currents, contributing to the increase of the vertical exchange amplitude between the ocean surface and its interior. To validate SWOT’s accuracy, we compare its small-scale observations with high-resolution temperature data collected during a 2023 research voyage. The results align well with subsurface temperature patterns.
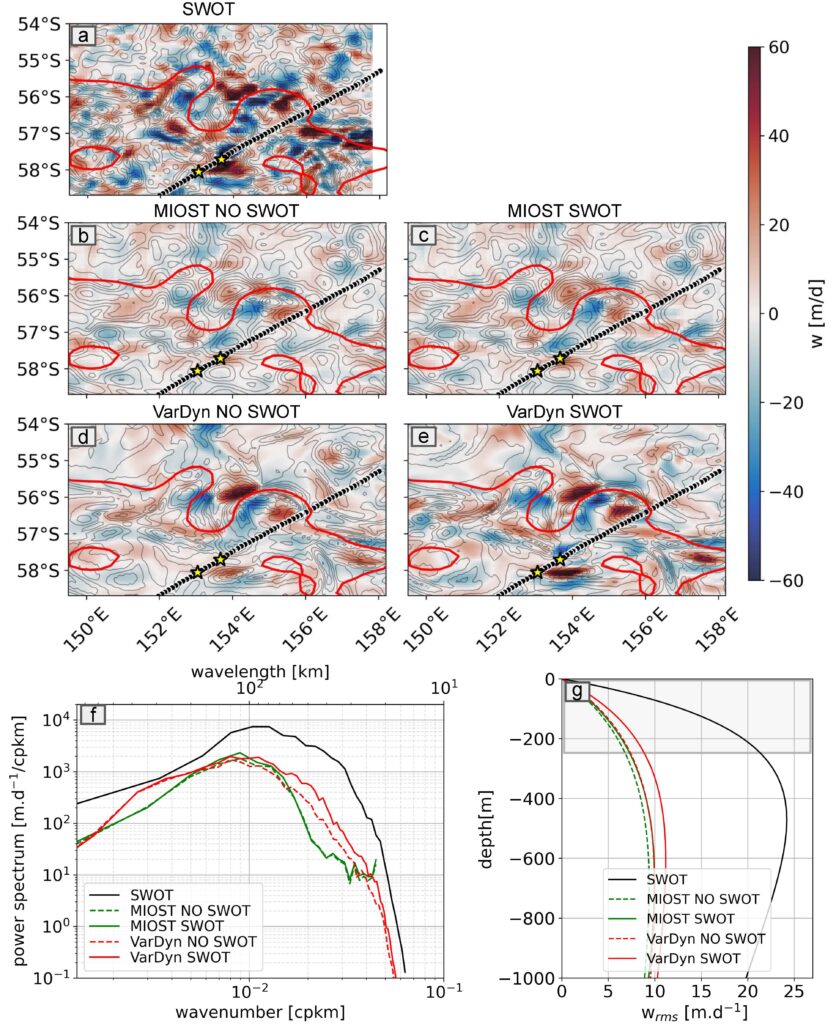
Finally, advanced mathematical techniques allow us to estimate vertical ocean motions down to 1000 meters. SWOT shows double the amplitude of the vertical exchange compared to conventional satellites, which may incur in strong local biological processes that we will investigate in the future.
For further details, refer to the full paper: https://doi.org/10.1029/2024JC022307