A 25-year assessment of Hot and Dry Weather Compound events in Europe using Earth Observation
- Project by: Science Hub Team
- March 15, 2024
Hot and Dry Weather Compound events (HDCEs) represent an emerging domain in meteorology, characterized by the simultaneous or sequential occurrence of multiple weather and climate drivers and/or hazards that culminate in large impacts on both the environment and society. This concept has been increasingly recognized in recent literature (e.g., Zscheischler et al., 2020; Raymond et al., 2020). Notably, the cumulative effects of such events are often significantly greater than the aggregate impacts of individual events. Despite growing interest, several scientific gaps persist, including the absence of a universally accepted definition for compound heat and drought events. The mechanisms and dynamics underlying these events remain inadequately understood. Moreover, specific phenomena such as dust storms have not been extensively analyzed within the context of compound events, as noted in the IPCC Sixth Assessment Report (AR6).
This study primarily examines co-occurring and successive hot and dry compound events in Europe, with a focus on four natural hazards: Heatwaves, Droughts, Wildfires, and Dust Storms.
Objectives
The principal objective is to compile a comprehensive HDCE catalog, employing a robust detection algorithm applied to extensive long-term Earth Observation (EO) data. Analysis of this catalog aims to pinpoint HDCE hotspots within Europe, elucidating prevalent trends and seasonal patterns.
Data
The research utilizes variables from the European Space Agency’s Climate Change Initiative (ESA CCI). This initiative offers global, long-term (approximately 40 years), continuous EO datasets designed for Earth monitoring. These datasets provide a detailed global record of gridded essential climate variables as mandated by the UNFCCC. For this study, four specific ESA CCI variables were employed to identify four natural hazards:
- ESA CCI Land Surface Temperature: Utilized to identify severe heatwaves, available monthly from 1996 to 2020 on a 0.25° x 0.25° grid.
- ESA CCI Fire: Facilitates wildfire identification through burned area data, available monthly from 1996 to 2020 on a 0.25° x 0.25° grid.
- ESA CCI Soil Moisture: Used to detect severe droughts, with data available daily from 1996 to 2020 on a 0.25° x 0.25° grid.
- ESA CCI Aerosol: Employs Dust Aerosol Optical Depth for dust storm identification, available monthly from July 2007 to 2020 on a 1° x 1° grid.
Methodology
Initially, all ESA EO data are interpolated onto a uniform monthly grid of 0.25° x 0.25°, spanning from 1996 to 2020. Subsequently, the individual four natural hazards are identified monthly using masks derived from established thresholds. This approach ensures a consistent and comprehensive analysis of the diverse data sets, facilitating a nuanced understanding of the spatial and temporal dynamics of HDCEs across Europe.


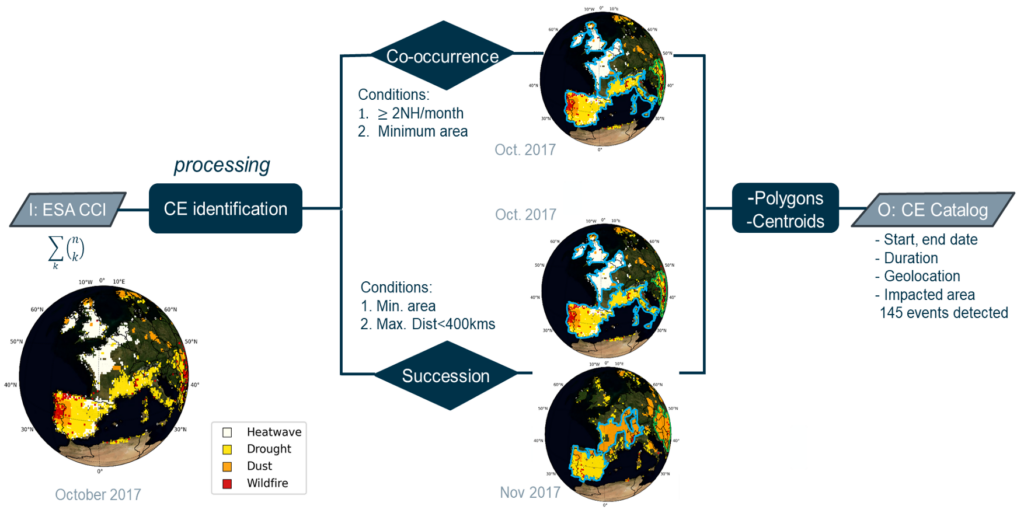
These masks are then aggregated monthly, wherein each grid point is assigned a value ranging from 0 (indicating no natural hazard occurrence) to a maximum of 4 (indicating the occurrence of all four natural hazards). This aggregated data forms the input for a Compound Events Systematic AlgoRithm (CESAR, see Figure 1). CESAR operates in several stages to identify and analyze compound events: -Initial Identification: The algorithm starts by identifying regions affected by one or more natural hazards on a monthly basis. This identification is crucial to pinpoint areas of potential compound event occurrence.
- Onset of Compound Events: A compound event is flagged if, within the same month (denoted as M), more than two natural hazards occur concurrently. Additionally, the algorithm considers the occurrence of a compound event if, in the subsequent month (M+1), the same region is affected by any natural hazard that had also occurred in month M.
- Tracking Events: Upon identifying the onset of a compound event, CESAR systematically tracks these events over time and space. The tracking continues until the predefined conditions of a compound event are no longer met.
- Data Recording: Throughout the process, CESAR records various characteristics of each event. These characteristics include the start and end time, geographical location, impacted area, and the duration of the event. -Analysis: The recorded data are then subjected to comprehensive analysis to derive insights into the nature, frequency, and impact of these compound events.

Results

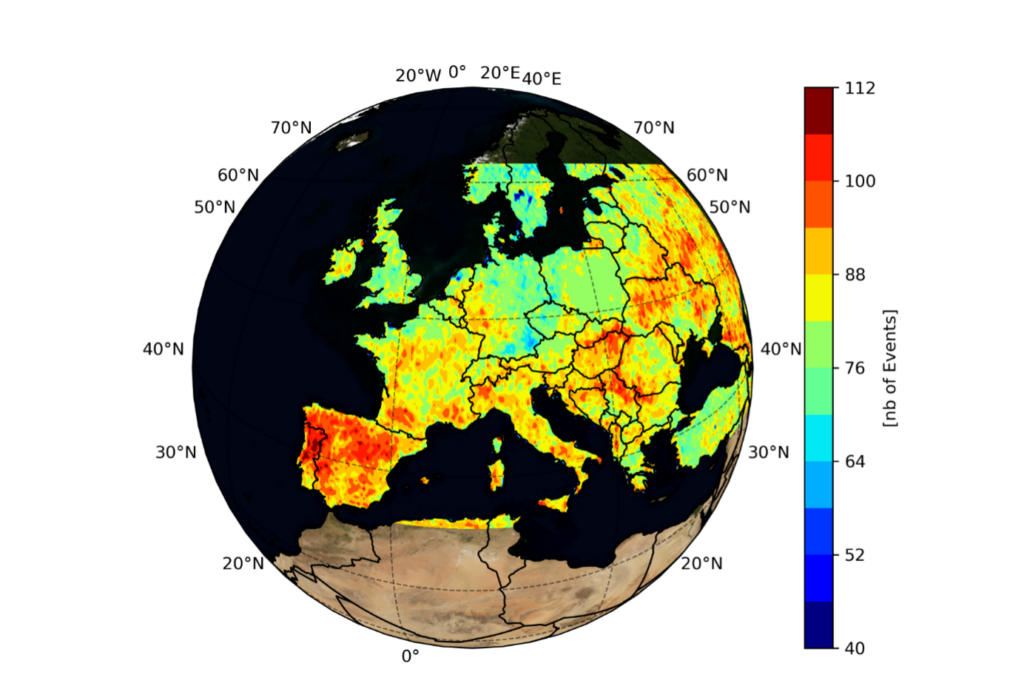
The data visualized in Figure 2 derive from an aggregation of polygons identified by CESAR. These polygons represent areas affected by HDCEs, and their summation provides a comprehensive view of the geographical distribution and frequency of these events. The analysis reveals that Northern Spain and Portugal are the regions most profoundly affected by HDCE events. This finding is significant as it highlights these areas as primary hotspots for such compound events. In addition to the primary hotspots, the study identifies several other regions with notable, albeit less frequent, occurrences of HDCEs. These include Southwestern France: A region where HDCE events are observed, though with lesser frequency and intensity compared to Northern Spain and Portugal; Northwestern Italy: This area also exhibits occurrences of HDCEs, indicating a geographical spread of these events into the Mediterranean basin and Central Europe: While not as heavily impacted as the aforementioned regions, Central Europe shows evidence of HDCE occurrences, suggesting a broader geographical impact across the continent.

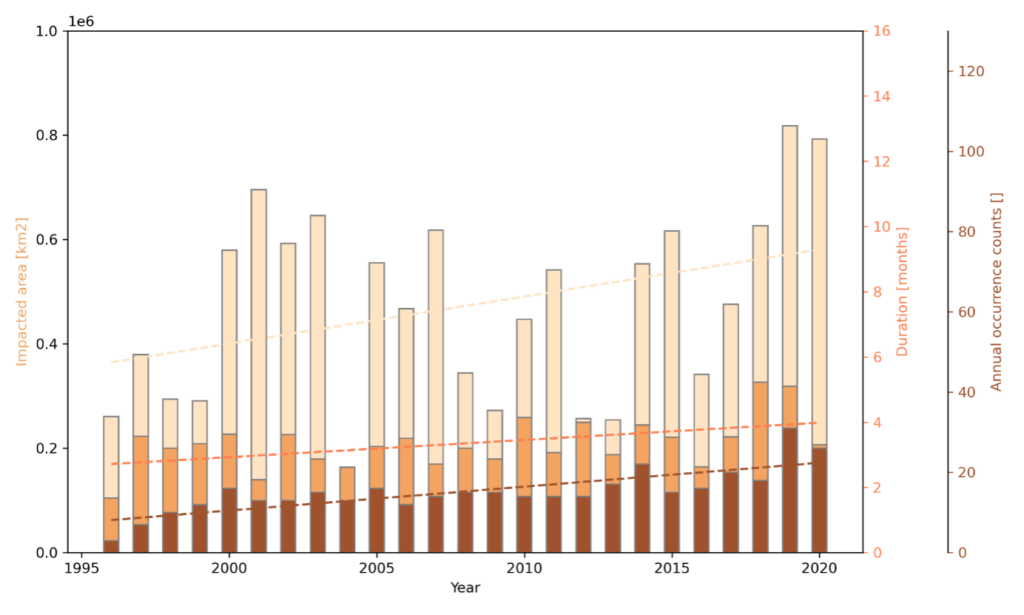
Figure 3 in the study provides a temporal analysis of three critical physical characteristics of Hot and Dry Weather Compound Events (HDCEs), as discerned through the Compound Events Systematic Algorithm (CESAR). The analyzed physical Characteristics include the duration of Event: This measures the length of each HDCE, presented in months. It provides insight into how long these events typically last. Then, the Annual Frequency: This represents the number of HDCE occurrences each year, offering a perspective on the regularity of these events; and also the Averaged Impacted Area: Expressed in 10^6 square kilometers, this metric illustrates the average scale of area affected by each HDCE.
The trends for each of these characteristics are depicted using dotted lines in the graph.
Significantly, all these trends are positive and statistically significant, indicating an increase over time in the duration, frequency, and impacted area of HDCEs. This observation is crucial as it is derived solely from Earth Observation data, reinforcing the reliability and significance of remote sensing in studying climate-related phenomena.
Perspectives for Future Research:
Building on the findings of this study, future research aims to explore atmospheric precursors that occur weeks to months prior to the onset of a detected HDCE. This exploration will enhance the understanding of the lead-up conditions to these events, potentially offering insights into early warning signals and preventive measures. The investigation will leverage the comprehensive 25-year HDCE catalog, enabling a deeper analysis of the atmospheric dynamics preceding HDCEs.
This research is carried out by Elody Fluck.

